Last updated on September 25th, 2024 at 09:09 am
Trading can be too much to handle sometimes, especially if you don’t know how the market is about to move. Wouldn’t it be easier to have a tool to tell you how the market will move? Whether it will be the same or change – That’s where the Guppy Multiple Moving Average (GMMA) indicator comes in handy.
This post will walk you through the concept of the Guppy Multiple Moving Average, or GMMA tool, and how to set it up. Then, we will dive into how to use it for trading, identifying trends, and spotting changes.
Understanding the GMMA Indicator

The Guppy Multiple Moving Average (GMMA) is a trading tool that helps you determine the trends and changes in the market. It views the market into two groups – Short-term traders and long-term traders. The tool divides these groups and monitors their movements in the market to determine larger trends.
The two groups are just different types of averages. They are known as Exponential Moving Averages. First, there is a group of short-term EMAs that react rapidly to changes in price. The short-term EMAs show the current state of the market. Second, there is a group of EMAs with a longer time frame that moves more slowly. They are larger and show the direction in which the market is moving.
GMMA is one of the best technical tools for investors as it shows how the relationship between short-term and long-term waves indicates trends. GMMA combines exponential moving averages (EMAs) on an underlying price chart.
When the short-term line crosses above the long-term line, it indicates that prices will likely rise. The wider the gap, the stronger the upward trend. If the long-term line crosses above the short-term line, it signals a likely price drop: the more significant the gap, the stronger the downward tendency.
READ MORE GMMA Guide: Avoid These 7 Mistakes
Setting Up the GMMA on Your Chart
Every trader has a different objective and style of trading, so it’s important that you customize the GMMA at your convenience. If you are a short-term trader, select shorter periods to get faster signals. Or, if you are a long-term investor, select a longer period to clear out small fluctuations and get a clear bigger picture.
1. Choose Your Trading Platform
If you are a beginner in the market, you can use TradingView; it has an easy-to-use interface, which makes it an excellent platform for newcomers. However, if you already trade on another platform, sign into your account; most platforms already have GMMA if you want to use it.
2. Add the GMMA Indicator
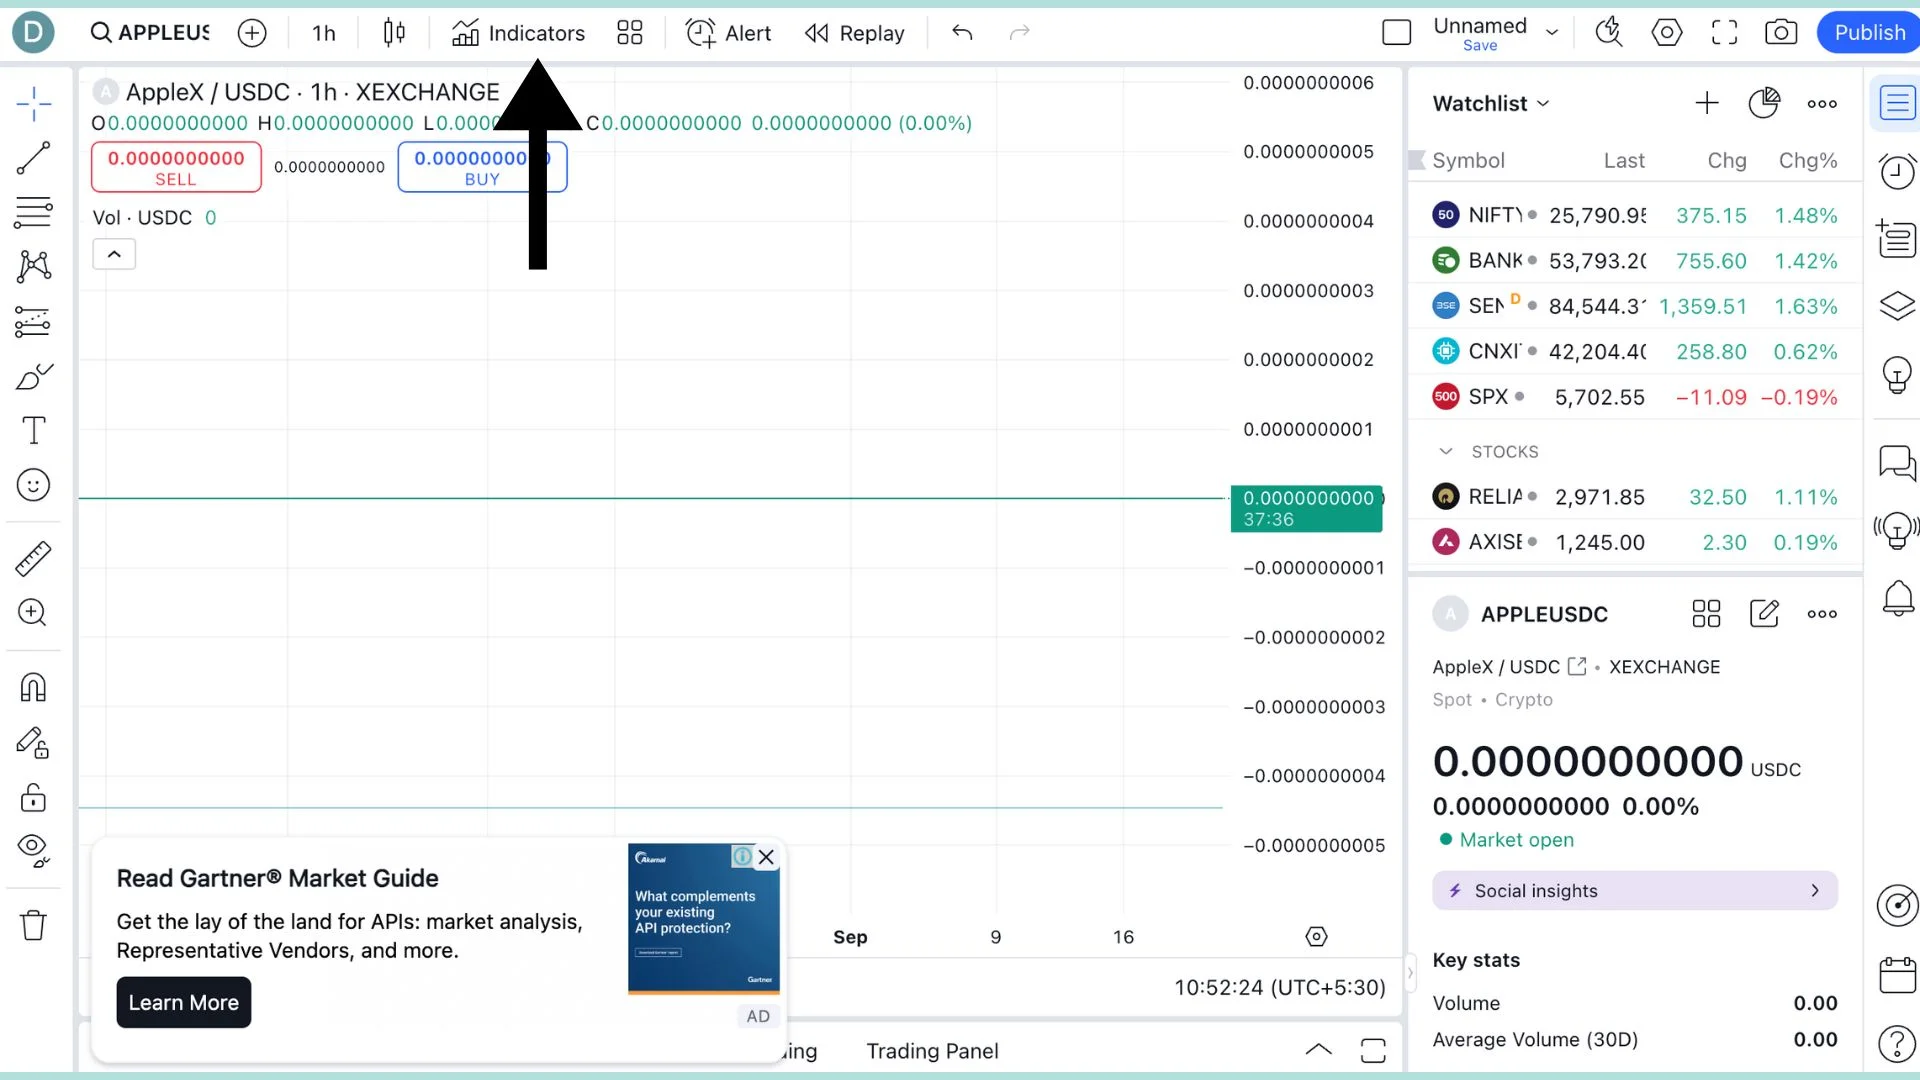
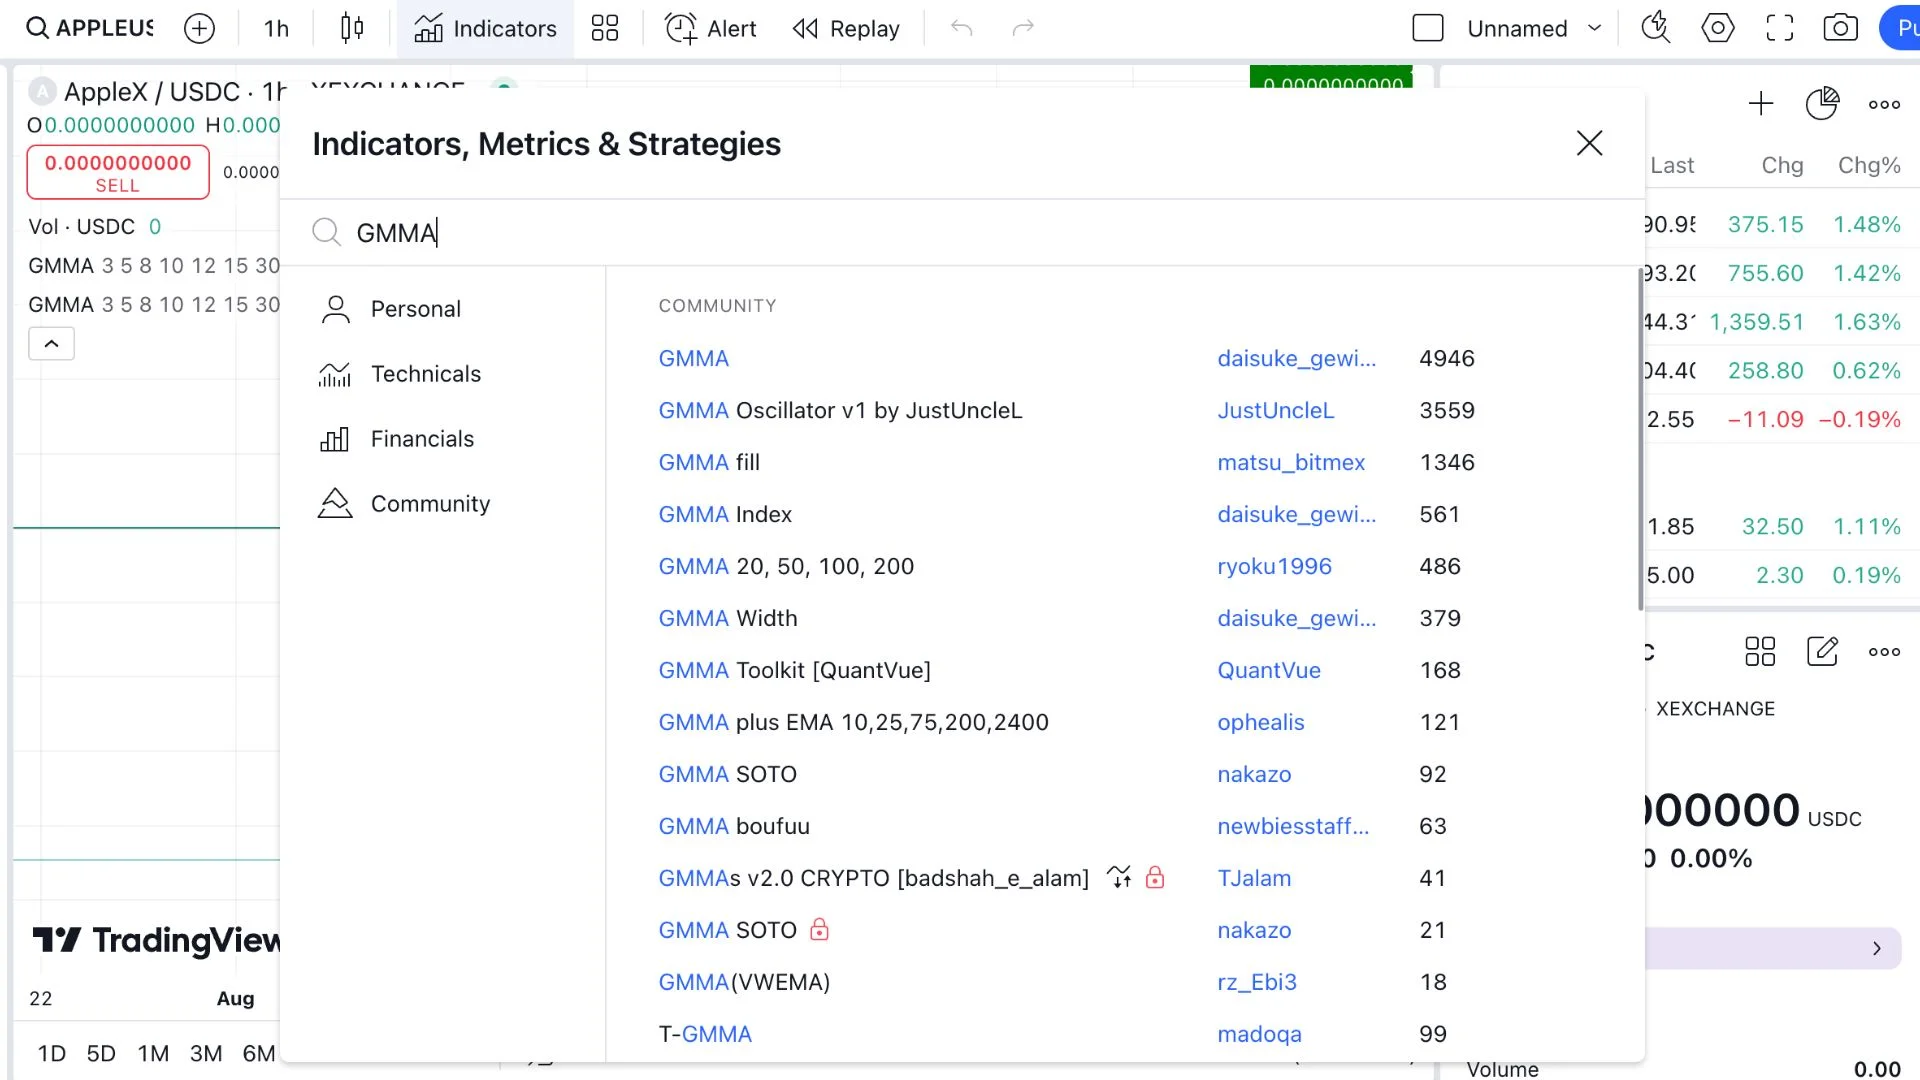
Once on the platform, go to your preferred stock and look for the area where you can insert indicators into your chart. It’s usually an option or button labeled “Indicators” or something similar. Clicking on the button should bring up a search box. Enter “GMMA” (or “Guppy Multiple Moving Average”) and choose it from the drop-down list.
3. Adjust the Settings
When you select the GMMA tool in indicators, certain lines and data will appear on the previously simple price chart. These lines are for short-term and long-term Exponential moving averages (EMA). The trading platform will automatically adjust the setting per the standard setting, but if you want things to look different as per your taste, you can make the needed changes.
Short-term EMAs are usually based on periods of 3, 5, 8, 10 and 12 days. Long-term EMAs, however, use 30, 35, 40, 50, and 60 days. The numbers indicate how many data days the EMA takes into account, and shorter periods are more responsive to changes in price.
4. Customize the Appearance
The GMMA can be customized to look exactly how you want it on your chart. To make it easier for traders to differentiate between long-term EMAs and short-term EMAs, some use different colored EMAs. You might, for example, choose lighter colors for short-term lines while darker ones for long-term. You can easily see the differences between the two trends.
Using GMMA for Trend Identification
GMMA acts as a map that indicates the possible direction of the market. You can tell if prices will go up or down by observing how short-term and longer-term lines interrelate. Here’s how to interpret the indicator:

1. Identifying Bullish Trends
A bullish market is when the prices of most of the stocks start to rise. While using the GMMA, the period when the short-term waves start to cross and go above the long-term waves is when the potential bullish market starts. If the short-term waves keep going farther from the long-term waves, the trend is strong and gaining momentum, which means the prices will continue to go up.
2. Identifying Bearish Trends
A market is said to be in a bearish state when the overall market’s price is falling. On GMMA, when the long-term waves cross and go above the short-term waves, it indicates that a bearish market is coming. In the same way, the further the spread increases, the stronger the trend is. The spread suggests that the downtrend is strong, and the prices will likely continue to fall further.
3. Flat or Sideways Markets
A flat or sideway chart on the stock indicates no significant movement in the market; these are normal day-to-day fluctuations. You can identify the sideway trend on GMMA if the long-term and short-term waves are intertwined. Don’t make any decisions during this trend; it’s best to wait until a different trend starts.
Using GMMA for Trend Confirmation
You can identify trends easily with GMMA, but the main part is when you confirm that this trend is correct and will continue. Even though GMMA is a powerful tool and you can rely on it, it’s best to use other tools to confirm the trend. Here are a few popular indicators that work well with the GMMA:
1. RSI (Relative Strength Index)
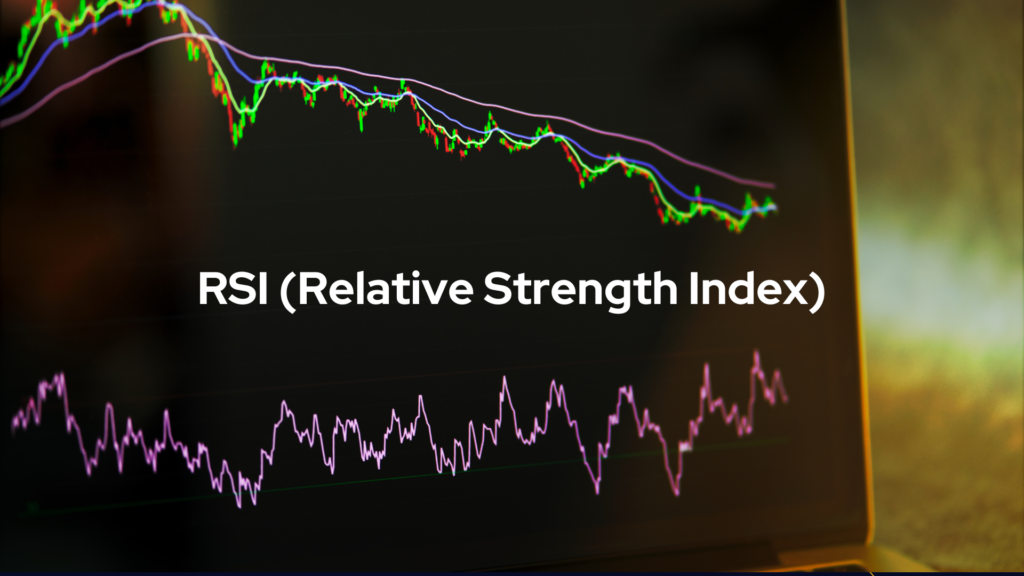
RSI is a momentum indicator that shows whether the market is oversold or overbought. Here’s how you use it when GMMA: If the GMMA indicates a bullish trend (rising prices), check the RSI score; if it is above 50, it confirms a bullish trend. On the other hand, if the RSI score is below 50, both aren’t showing the same trend, indicating an unconfirmed direction for the market.
2. MACD (Moving Average Convergence Divergence)
The MACD is also a momentum tracker, considering the relationship between the two groups and the share price. The MACD confirms the GMMA’s trend by displaying a crossover. When the MACD crosses above the signal, it confirms a bullish direction, while when it crosses beneath, it confirms a bearish direction.
3. Volume Analysis
The volume is the number of shares, contracts, or other instruments traded in a given period. It is a strong trend if the trading volume in this period is high. In contrast, if the trading volume is low, the trend is not as strong as suspected.
Wait for a clear distinction between the long-term and short-term lines to avoid false signals, indicating the trend is strong. More importantly, we should not rely solely on GMMA; we should use other indicators, such as the RSI or MACD, to confirm the trends GMMA indicates. Lastly, be patient; waiting for a trend’s complete development is better than jumping in too soon and ending up on the wrong end of a trade.
READ MORE : GMMA vs. Traditional Moving Averages
FAQs
How to read the GMMA indicator?
The GMMA indicator displays two moving averages: short-term and longer-term. If the short-term line is above the long-term line and spreads apart, this indicates an upward trend; if it falls below the long-term line, it indicates a downward trend.
How does GMMA work?
GMMA compares short-term and longer-term moving averages to determine the strength and direction of a market’s trend. The wider the distance between the two, the stronger the strength.
How to read the Moving Average Indicator?
To read a Moving Average Indicator, track the direction of the line: if it’s moving up, prices are rising, and if it’s moving down, prices are dropping. If the lines intersect and cross, they can signal potential trend changes.
Final Statement
GMMA is a great tool that can be used to confirm and identify trends. Understanding the relationship between shorter-term and longer-term long-term moving averages can help you confidently spot trading opportunities. But be aware that GMMA is just one of many tools you can use to trade. GMMA should be used simultaneously with other indicators. Many factors influence markets, and no single indicator can provide all the information.
When you start using GMMA as one of your primary indicators, take your time with it and understand how it works. Most of the strategies you use in the future will come with experience.
1 thought on “How to Use the GMMA Indicator for Trend Identification and Confirmation”