Last updated on April 11th, 2024 at 01:14 am
Isn’t watching a movie or video easier than reading about it? I mean, people do like reading over watching. But for me, watching is more thrilling and informative. That is a form of data and information visualization. The graphics, the way the information is presented, everything gets more fun and easier to understand with a visual representation of information.
In the same way, even in business presentations, graphic presentations are more attention-grabbing and fun. Although it’s business, explaining by words can sometimes be unclear to the team. But a visual explanation is always something that we can remember. This is because we have seen it and don’t have to create an image.
So, in this article, we will learn about What data and information visualization are.
What is Data and Information Visualization?

Data and information visualization is the concept of representing data and information visually for easier information communication. It is the process of using various visual representation tools to communicate better.
The commonly used term for this process is Data visualization. But what it means is information visualization. This is because the information is data integrated, summarisation, and contextualization. But usually, both are used as synonyms for each other. Hence it is called the data and information visualization process.
Data and information visualization is a field that is closely related to information graphics, scientific visualization, and statistical graphs. It helps decision-makers and users to see the analytics in visual and graphic form. It helps to understand complex concepts and finds new patterns.
With the help of interactive visualization, things are taken further. With technology, data can be presented in the form of charts and graphs for extra detail.
ALSO READ : 9 Types of Decision Support Systems in Business Intelligence You should know
Importance of Data and Information Visualization

When we read something, what we remember is words. Based on those words, we create a specific image of those words, which helps us remember and understand the data. This is how the human brain processes text data. But here, we have to use our imagination which does cause us to lose half of the information we read.
When we use representative visual tools such as charts and graphs, it helps us to understand complex data. It also helps us to memorize it quickly because the graphics are already presented. Data and information visualization is an easy method of conveying concepts. We can easily show our vision by this means to anyone.
Data and information visualization help us in the following way :
- They help us to identify fields that need improvements or more attention.
- Help us understand what factors affect consumer behavior.
- It clarifies what products have higher sales, what segment is buying them, what tweaks customers expect, and so on.
- It can help in forecasting sales volume.
Uses of Data and Information visualization
This technique of data and information visualization is being used in every industry. All types of businesses use this technique to convey their message to their stakeholders in an effective form. It has been a success, especially in the marketing industry.
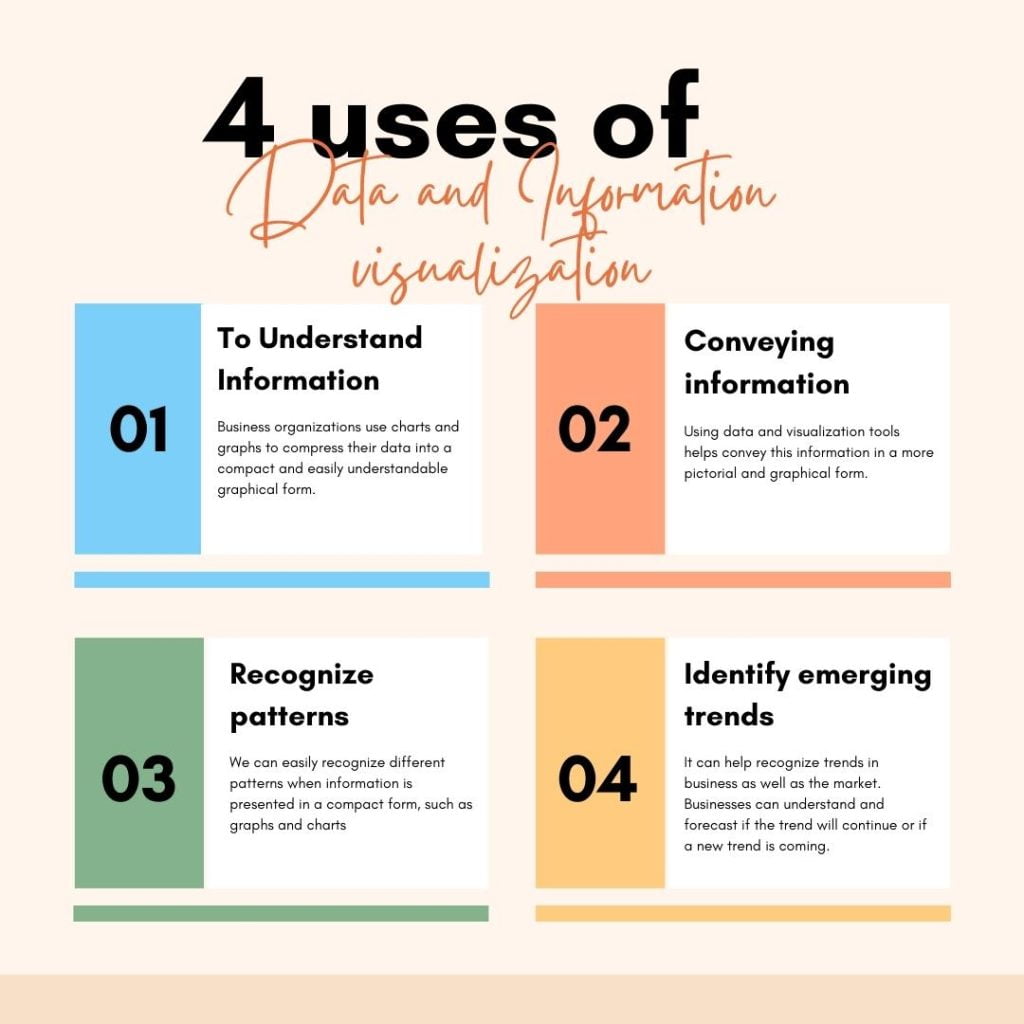
There are four main ways in which data and information visualization are being used. They are :

Understand Information
Business organizations use charts and graphs to compress their data into a compact and easily understandable graphical form. It helps the business understand a large amount of data instantly. Understanding this data then helps in the decision-making process.
Along with helping in the decision-making process, it also helps to understand the problematic field of the business. In the same way, it can also help to answer such problems in the business promptly.
Conveying information
The business acquires new insights using these data and Visualisation tools. Once they acquire these insights, the next step is communicating the data to their stakeholders.
Using data and visualization tools helps convey this information in a more pictorial and graphical form. It is easier for everyone to understand the data and have more impact with the visual aid.
Recognize patterns
We can easily recognize different patterns when information is presented in a compact form, such as graphs and charts. In the same way, a business can understand what patterns are being made and follow up on the data.
Even some unknown pattern will emerge that can help the business to recognize their threat and opportunities.
Identify emerging trends
Another way the data and visualization tools can be helpful is to understand current and new emerging trends. It can help recognize trends in business as well as the market. Businesses can understand and forecast if the trend will continue or if a new trend is coming. It will help them to be prepared for the upcoming changes.
When business is aware of the trends in the market, they can take advantage of these trends and proliferate. Knowing about trends can improve a business’s completive edge.
ALSO READ : 4 Important types of Information System in Computers – Meaning, Definition Concepts and Components
FAQs
What is visual data and information?
Data and information visualization is the concept of representing data and information in a visual form for easier information communication. It is the process of using various visual representation tools to communicate better.
Which tool is best for data visualization?
These are some of the best data visualization tools in the market :
Microsoft Power BI
Tableau
Looker
Zoho Analytics
Domo
Closing Statement
Data and information visualization is a useful concept used worldwide to communicate information. It helps business organizations to understand patterns and trends which can be useful for their growth. Not just for internal matters, data, and information visualization can also help a business for marketing purposes.
I hope this article about data and information visualization is useful for you. If you have any doubts or suggestions, Don’t try to visualize; write them down in the comment box.
“Let’s Achieve Financial Freedom”

