Last updated on September 25th, 2024 at 09:08 am
With all the indicators available for trading, it’s easy to be overwhelmed by the choices. Is there an effective way to get rid of the clutter and gain more clarity on how the market is moving? That’s where the Guppy Multiple Moving Average (GMMA) comes into play.
GMMA was developed by an Australian financial columnist and author, Daryl Guppy. He designed the GMMA to help traders anticipate potential breakouts and trend changes. Whether you’re just beginning to learn about trading or are a veteran, GMMA is a great tool for you. GMMA gives you valuable insight to help you make better-informed decision-making.
What is the GMMA Indicator?

Guppy Multiple Moving Average, or GMMA, was introduced by Daryl Guppy, who wanted to provide a better way of understanding market changes and trends. As per this model, we view the trading world from two perspectives – Short term trading and long-term trading. By understanding what both these groups are doing, we can determine which way the market is going to move.
For identifying potential changes and trends, the GMMA model combines both types of exponential moving averages (EMAs) on an underlying price chart. Through understanding the interaction between the two groups, GMMA offers information about market trends and provides early indicators for the possibility of price reversals or even continued trends.
Read More About How to Use the GMMA Indicator for Trend Identification and Confirmation
How Does the GMMA Work?
As we discussed earlier, GMMA divides the market into two sets of exponential moving averages (EMAs):
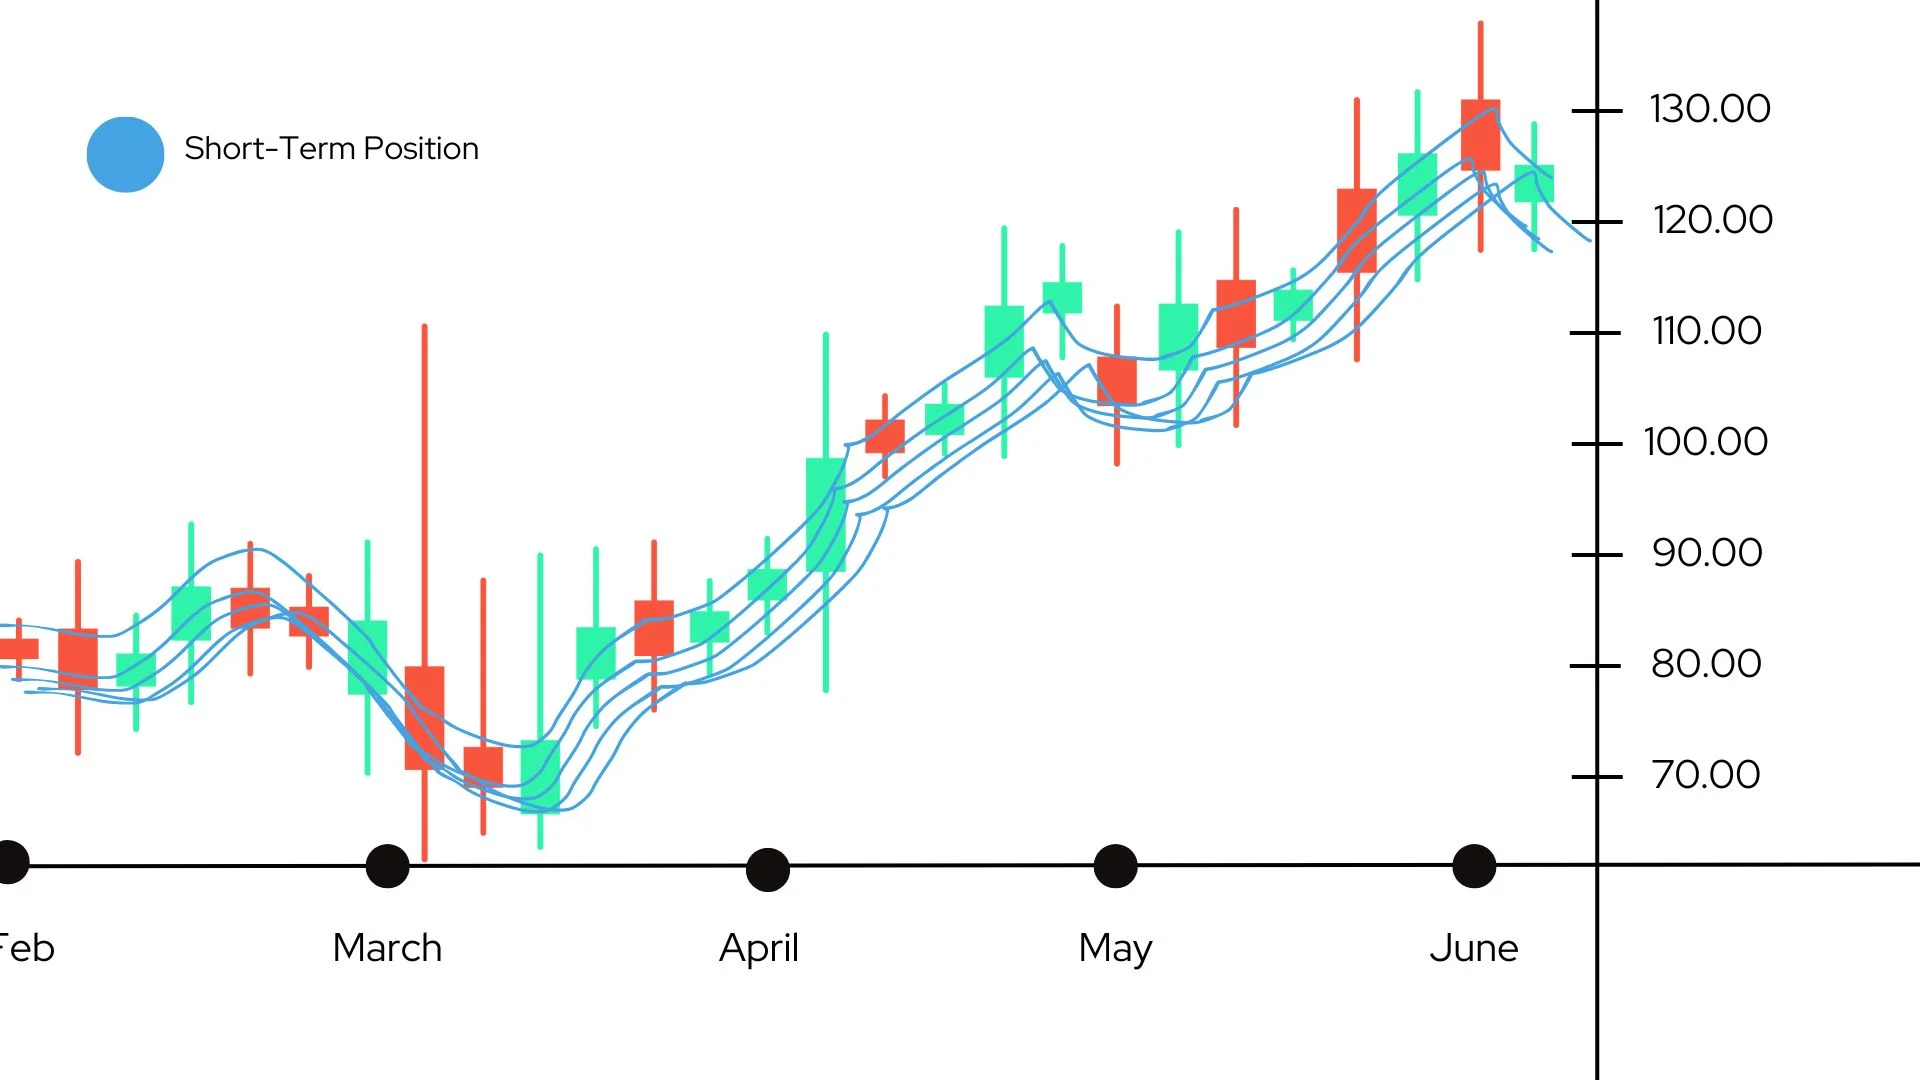
Short-term Group (3, 5, 8, 10, 12, 15 periods):
The Group is quick to react to price changes and captures the activities of short-term traders that regularly occur between and within the market. The EMAs in this Group are highly sensitive and can react rapidly to even the most minor changes in the market. If you observe these short-term lines begin to rise, they indicate that traders are pushing the price up.

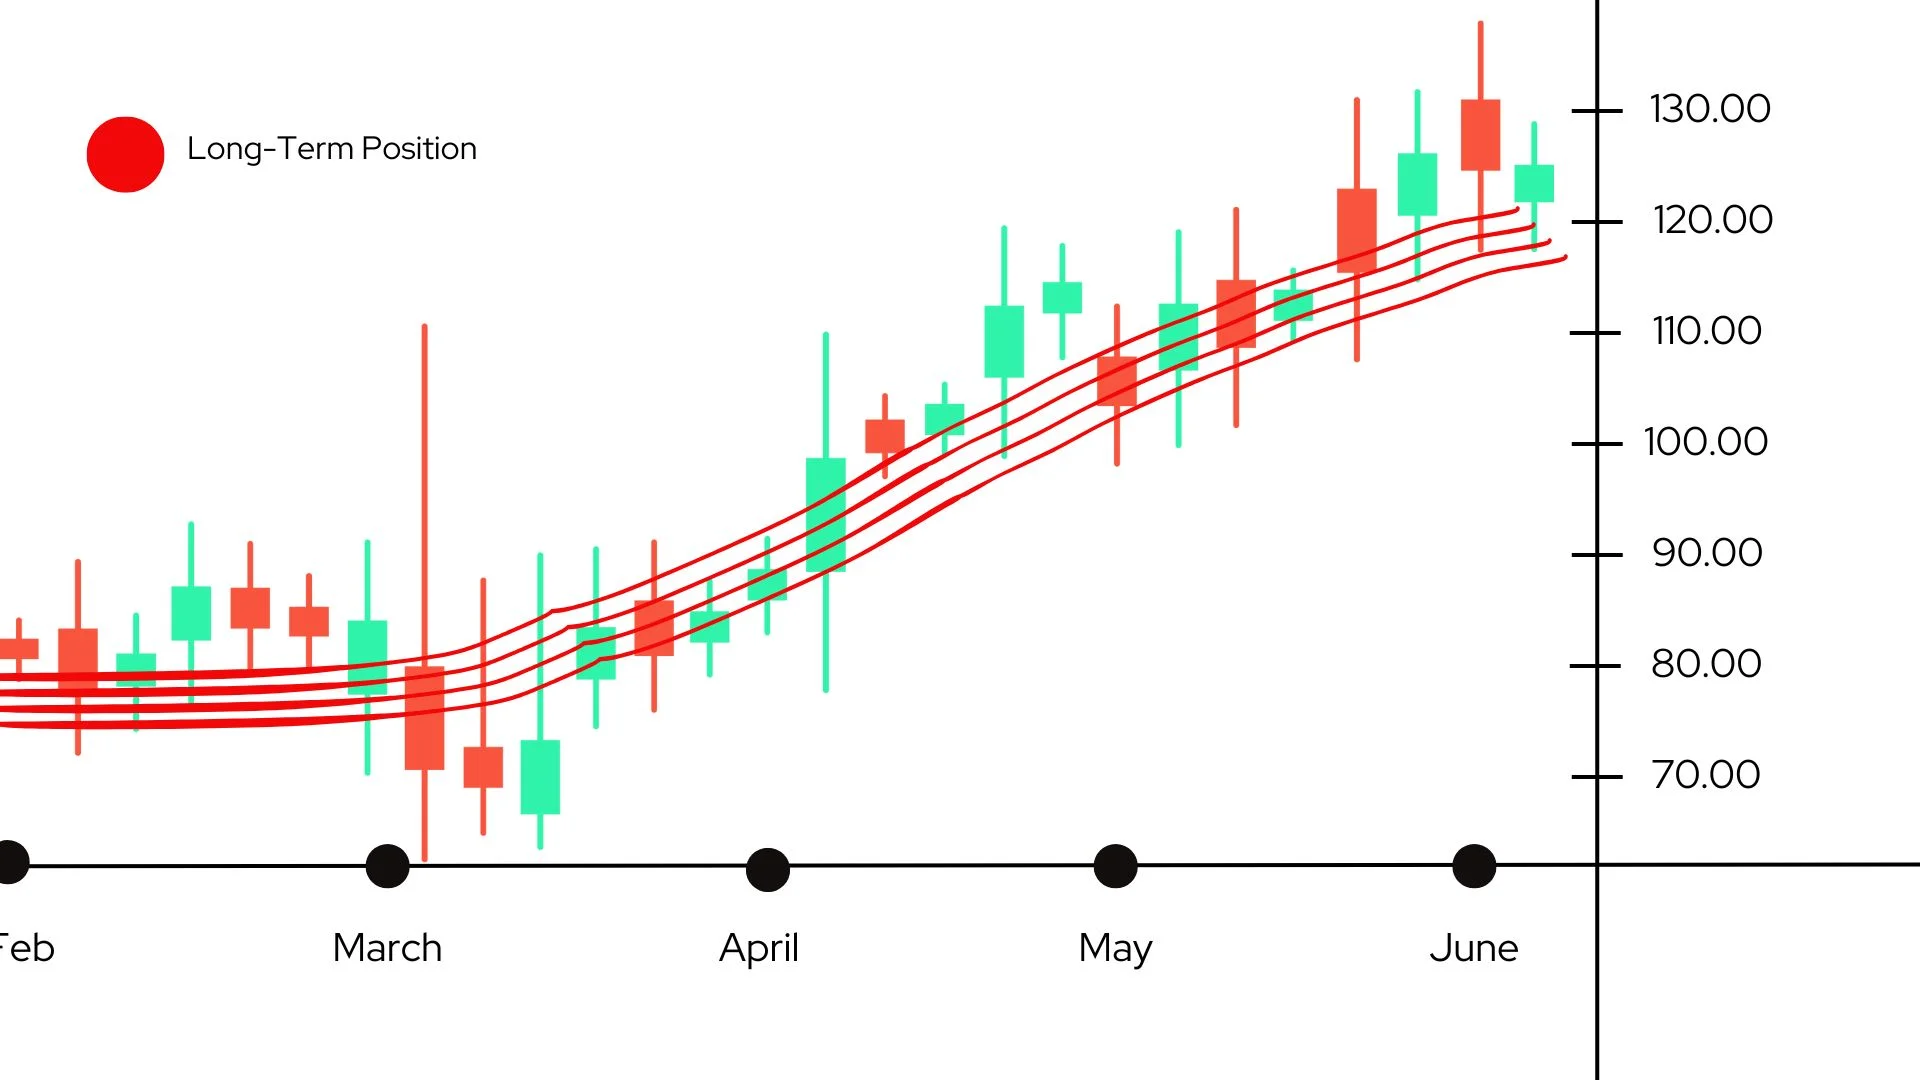
Long-term Group (30, 35, 40, 45, 50, 60 periods):
This category moves slower and is indicative of the more steady hand of investors in the long run who do not care as much about the daily volatility and are more focused on the larger trends. The EMAs function as filters, removing all the noise and revealing the fundamental trend. If the longer-term lines are rising, it means that overall sentiment in the market is favourable.

Interpreting the Interaction

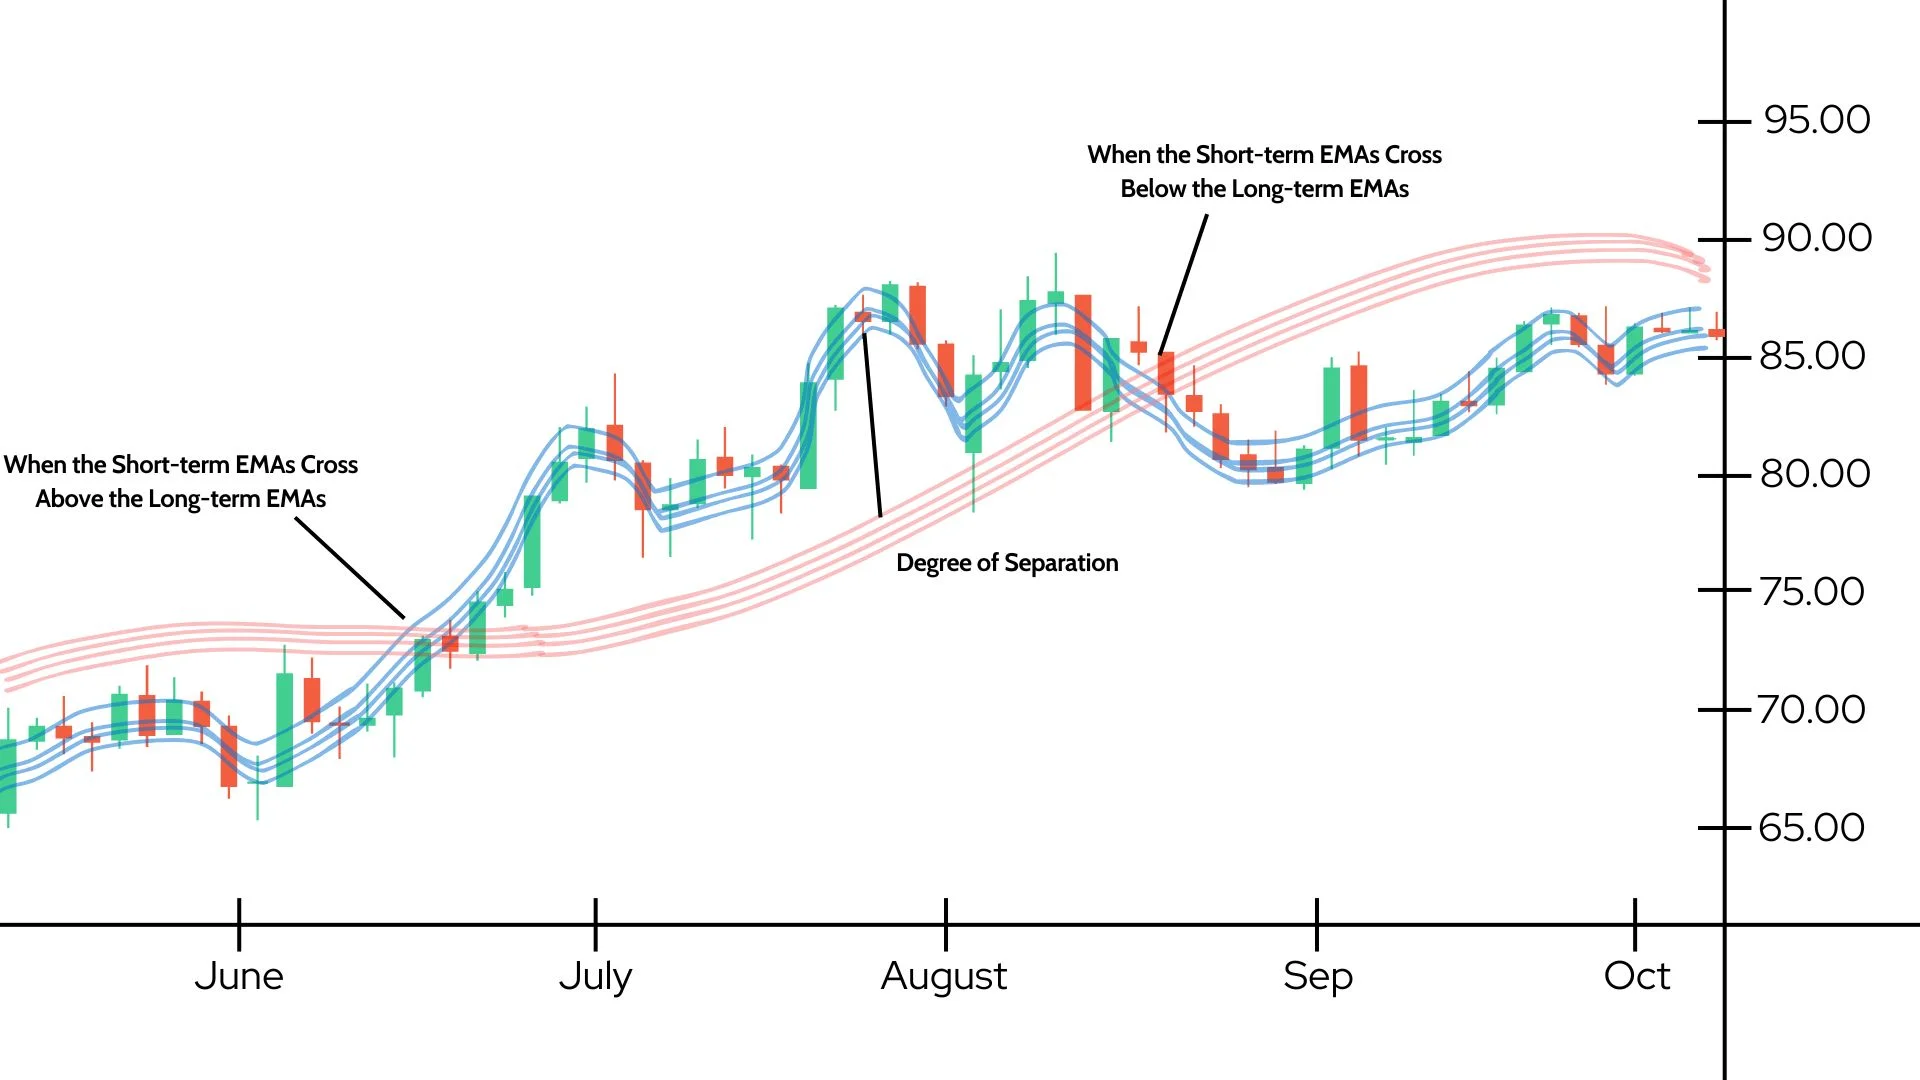
1. When the Short-term EMAs Cross Above the Long-term EMAs
This is among the primary signals that the GMMA will give you. It suggests that traders who trade in the short term are getting more aggressive and that a rising trend could be developing. It is usually a sign to look into purchasing or adding to the position.
2. When the Short-term EMAs Cross Below the Long-term EMAs
If the EMAs for short-term timeframes fall below those of the long-term EMAs, It’s an indication that the momentum has slowed down and that a decline could appear on the horizon. This indicates a signal to reduce or sell the size of your portfolio.
3. The Degree of Separation
The gap between the two sets of EMAs will also reveal a great deal about how strong the current trend is. A wide separation is a sign that the trend is healthy and strong either way. If the lines begin getting closer to each other or cross each other, it may suggest that the trend may be slowing down, and markets could be in the phase of consolidation or a sideways move.
READ MORE GMMA Guide: Avoid These 7 Mistakes
Why is the GMMA Useful?
The main question is, why should you use the Guppy Multiple Moving Averages instead of others? Here’s why:
Anticipating Market Moves
One of the most difficult tasks for traders is keeping ahead of changes in the market. The GMMA aids by giving an early warning of possible trend shifts. If short-term moving averages are beginning to diverge from long-term ones. This could indicate that something important is taking place on the market. It gives you the chance to make yourself stand out from the pack, whether it is by pursuing a new investment or altering the existing one.
Confirming Trends
You know those situations where you are wondering whether the same trend will continue or not? The GMMA will help you clear the confusion. If the short-term averages intersect and are above long-term averages, this is a clear indication that the current trend is strong and will likely last. In contrast, if the short-term mean crosses lower and then stays at the same level, it could be time to plan for a decline. With these verifications, the GMMA allows you to trade with more confidence.
Filtering Market Noise
The market can be noisy, and price swings aren’t always indicative of a real trend. GMMA assists in removing the noise, making sure to focus on the interactions between long-term and short-term averages. So you’re less likely to get confused by small price movements and are able to focus on the big picture and whether the market truly is going in a direction or is just moving around.
READ MORE : GMMA vs. Traditional Moving Averages
FAQs
What does GMMA mean?
GMMA stands for Guppy Multiple Moving, a trading indicator that mixes both long- and short-term moving averages to aid in identifying patterns and possible market shifts.
How to read the GMMA indicator?
To understand the GMMA, take a look at the way that small-term averages interact with those of the longer-term. When they cross over the longer-term average, this suggests that there is an upward trend. When they meet below, they indicate a decline.
How to use the moving average multiple indicator?
To use a multiple moving average indicator such as the GMMA application to your chart. Watch for crossing points of both long-term and short-term averages using these indicators to help you make your trades.
Final Statement
For a quick overview to recap, the GMMA can be described as a tool which blends long-term as well as short-term exponential moving averages in order to provide an accurate picture of the market’s trends. It can help you spot possible trends, verify current trends, cut out the noise of markets and noise, and help you make informed decisions about trading.
Keep in mind that the GMMA isn’t a magic bullet, but it is an effective companion to your journey to trading. Take your lessons learned, put them to your trading and see the way this indicator helps to gain an additional degree of understanding about markets’ changes. Have fun trading!


3 thoughts on “Guppy Multiple Moving Average (GMMA)”